Formula 1 is a motorsport of the highest level combining engineering, physics, human skill and team strategy at the limits of performance featuring the world's most innovative constructors and talented drivers. It is the pinnacle of automotive innovation, and with the rise of F1 in mainstream media, it is easy to see why the thrill of racing at 200+ mph captivates so many of us.
This project focuses on building end-to-end analytics pipeline on F1 racing data using Databricks and Azure Cloud. Data is ingested from Ergast API, and processed through Medallion Architecture (Bronze -> Silver -> Gold) to build curated models for visualization and insights in Power BI.
Project Goals
- Build architecture for compute, storage, analytics, governance, and orchestration required for end-to-end analytics.
- Build ELT pipeline using Medallion Architecture in Databricks to create curated analytical models from raw source data.
- Design Incremental Load logic to manage new data and consolidate with existing data while ensuring idempotent pipelines.
- Build tables in Delta Lake to take advantage of Delta Table features.
- Orchestrate pipeline execution according to required refresh frequency.
- Implement Unity Catalog to build governance practices and use catalog features for data discovery, audit and management.
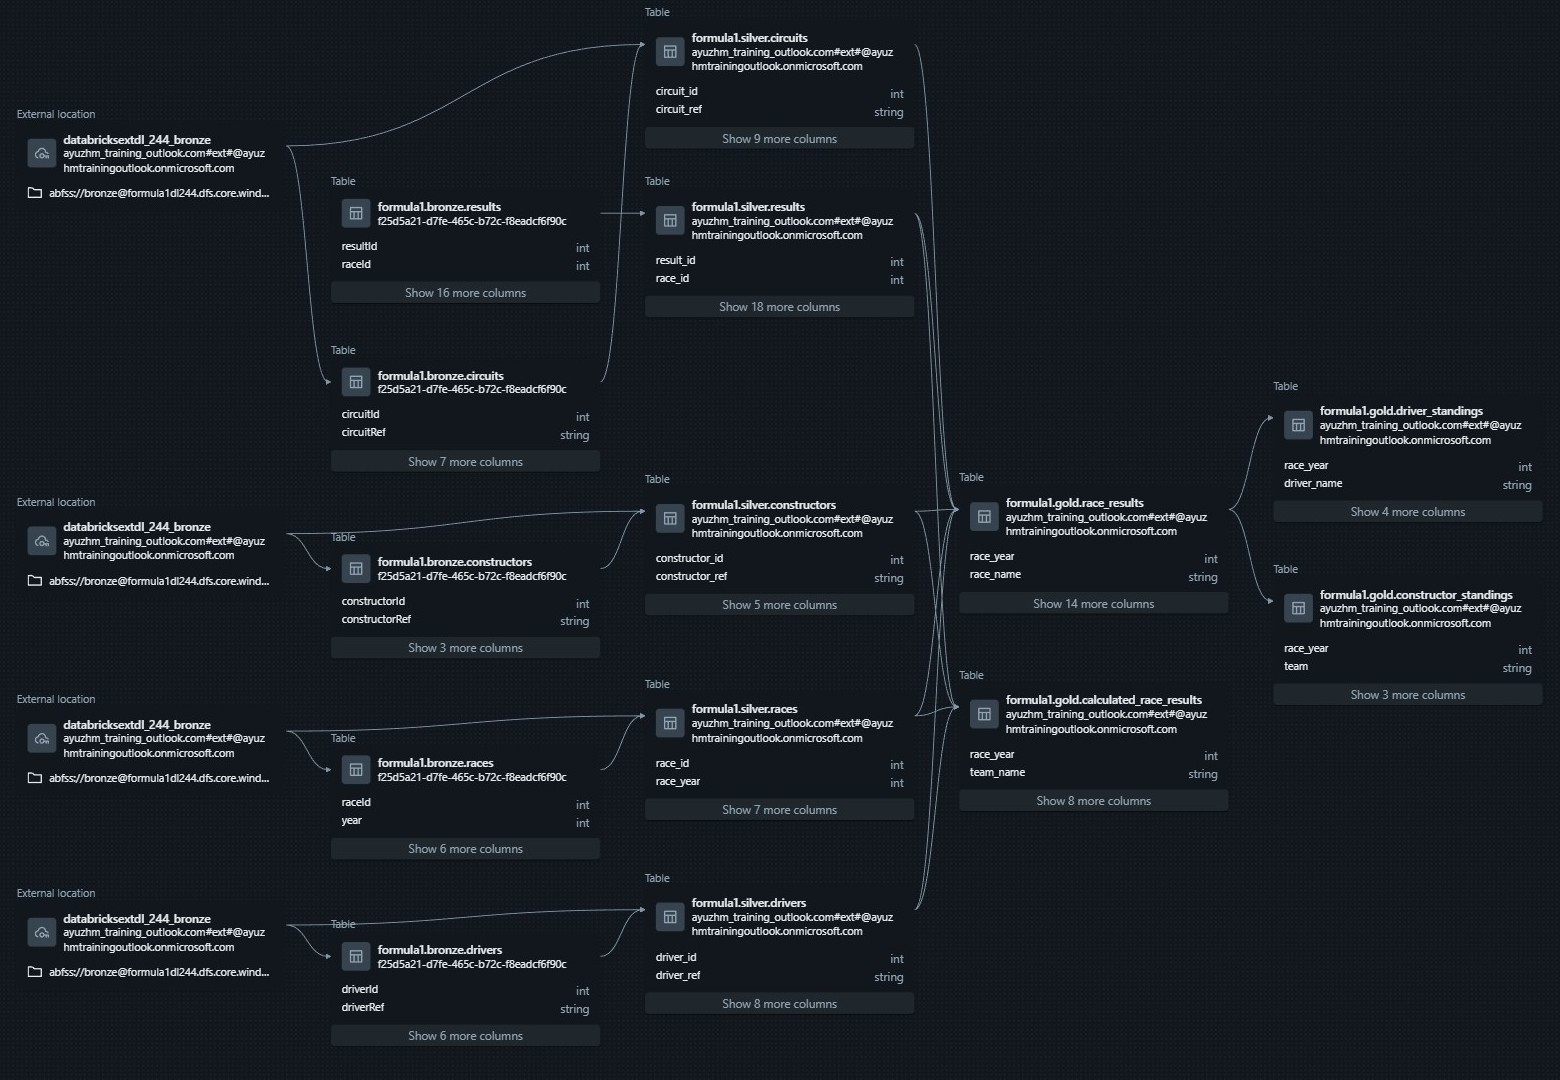
Architecture Overview
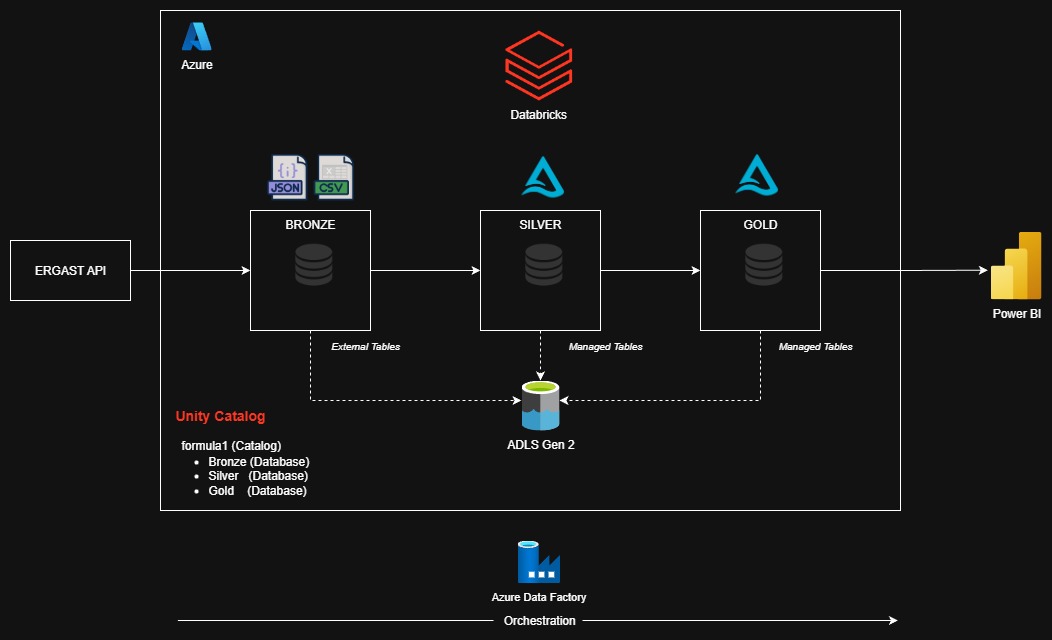
The data for this project was sourced from Ergast API. Databricks served as the analytics platform, where ELT pipelines were built following
Medallion Architecture. Unity Catalog was used to organize and govern the data within a single catalog formula1 containing three databases:
Bronze, Silver, and Gold. Each database was stored in separate containers in Azure Data Lake Storage Gen2.
The Bronze layer stores raw data as External Tables referencing JSON and CSV files. The Silver and Gold layers store structured and curated Delta Tables as Managed Tables.
Azure Data Factory orchestrates the data pipeline on a weekly refresh schedule, and PowerBI connects to the Gold Layer to deliver analytical visualizations and insights.
Technologies Used
| Storage | Azure Data Lake Storage 2 |
| Compute | Databricks / Pyspark |
| Governance | Unity Catalog |
| Orchestration | Azure Data Factory |
| Visualization | Power BI |
Medallion Architecture Overview
Medallion Architecture was implemented to incrementally improve data quality and structure as it moved through the pipeline:
| Bronze | Stores raw data ingested from Ergast API (JSON/CSV). External Tables were built on top of the raw files with manually defined schemas. |
|---|---|
| Silver | Refines data from the Bronze layer by standardizing formats, removing duplicates, renaming columns to snake_case,
flattening nested structures, and adding metadata fields such as ingestion_date and data_source. This layer provides
clean, analytics-ready tables. |
| Gold | Produces business-level curated models used for reporting and dashboarding. Tables from Silver Layer were joined and aggregated to present unified tables, such as race results, driver standings, and constructor performance over seasons. |
Table Inventory
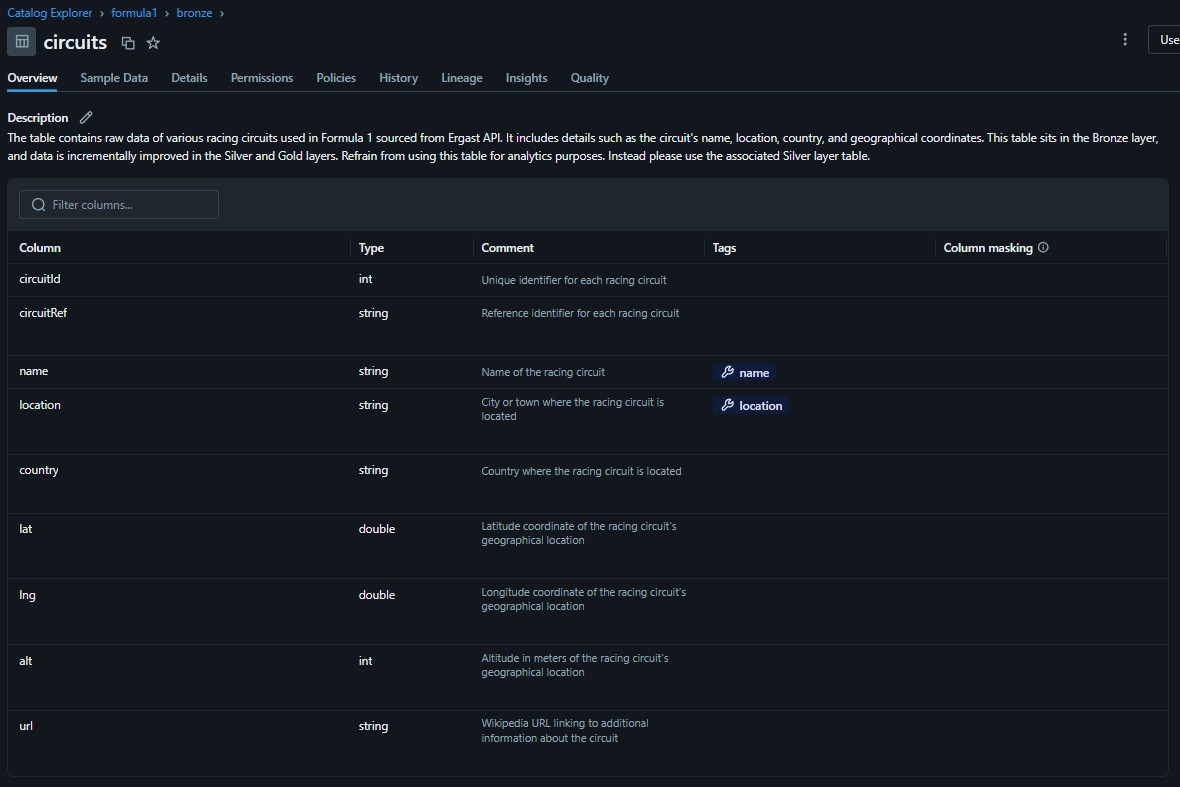
Bronze
Circuits
- circuitId
- circuitRef
- name
- location
- country
- lat
- lng
- alt
- url
Races
- raceId
- year
- round
- circuitId
- name
- date
- time
- url
Constructors
- constructorId
- constructorRef
- name
- nationality
- url
Drivers
- driverId
- driverRef
- number
- code
- name: forename, surname
- dob
- nationality
- url
Results
- resultId
- raceId
- driverId
- constructorId
- number
- grid
- position
- positionText
- positionOrder
- points
- laps
- time
- milliseconds
- fastestLap
- rank
- fastestTime
- fastestLapSpeed
- statusId
Pitstops
- raceId
- driverId
- stop
- lap
- time
- duration
- milliseconds
Lap Times
- raceId
- driverId
- lap
- position
- time
- milliseconds
Qualifying
- qualifyId
- raceId
- driverId
- constructorId
- number
- position
- q1
- q2
- q3
Silver
Circuits
- circuit_id
- circuit_ref
- name
- location
- country
- latitude
- longitude
- altitude
- data_source
- file_date
- ingestion_date
Races
- race_id
- race_year
- round
- circuit_id
- name
- race_timestamp
- ingestion_date
- data_source
- file_date
Constructors
- contructor_id
- constructor_ref
- name
- nationality
- data_source
- ingestion_date
- file_date
Drivers
- driver_id
- driver_ref
- number
- code
- name
- dob
- nationality
- data_source
- file_date
- ingestion_date
Results
- result_id
- race_id
- driver_id
- constructor_id
- number
- grid
- position
- position_text
- position_order
- points
- laps
- time
- milliseconds
- fastest_lap
- rank
- fastest_lap_time
- fastest_lap_speed
- data_source
- file_date
- ingestion_date
Pitstops
- race_id
- driver_id
- stop
- lap
- time
- duration
- milliseconds
- data_source
- ingestion_date
Lap Times
- race_id
- driver_id
- lap
- position
- time
- milliseconds
- data_source
- ingestion_date
Qualifying
- qualify_id
- race_id
- driver_id
- constructor_id
- number
- position
- q1
- q2
- q3
- data_source
- ingestion_date
Gold
Race Results
- race_year
- race_name
- race_date
- circuit_location
- driver_name
- driver_number
- driver_nationality
- team
- grid
- fastest_lap
- race_time
- points
- position
- race_id
- file_date
- ingestion_date
Driver Standings
- race_year
- driver_name
- driver_nationality
- total_points
- wins
- rank
Constructor Standings
- race_year
- team
- total_points
- wins
- rank
Calculated Race Results
- race_year
- team_name
- driver_id
- driver_name
- race_id
- position
- points
- calculated_points
- created_date
- updated_date
Key Technical Highlights
Delta Lake
Delta Lake was used as the core storage layer on top of ADLS. Delta lakes enables efficient query performance while still leveraging open storage formats such as Parquet and JSON. It enables ACID transactions which allows additional functionality to update and delete individual records. The Merge functionality in Delta Lake plays a critical role in incremental load processes.
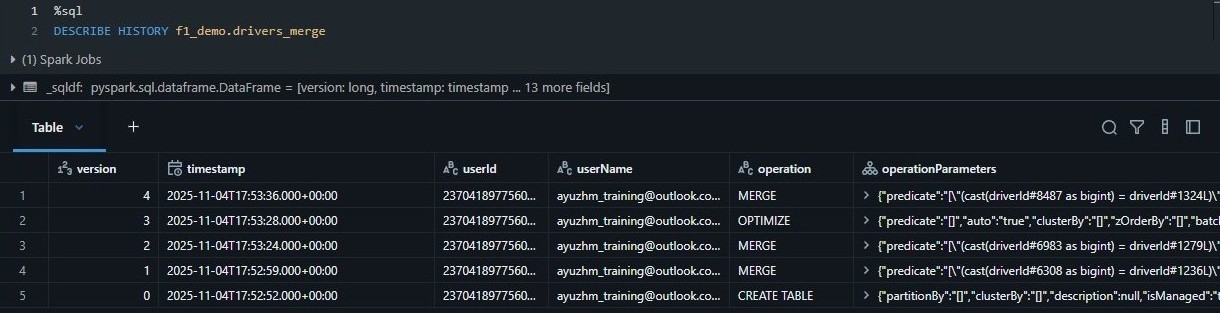
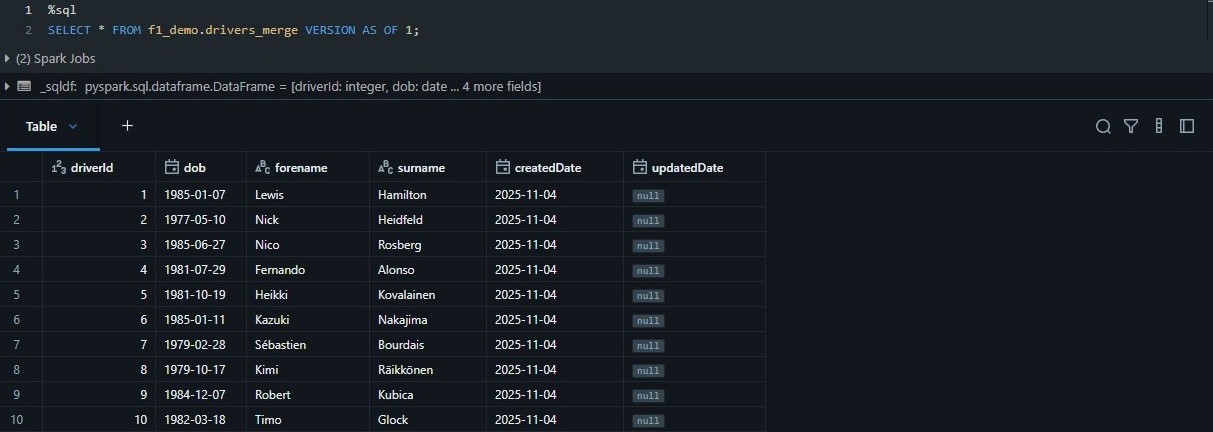
The Delta Transaction Logs provides a full audit history of table changes and supports versioning, allowing tables to be rolled back or queried as-of a specific point in time. This ensure data reproducibility and reliability across pipeline runs.
Incremental Load
Races in Formula1 usually occur weekly during the season. The pipeline was designed to idempotently load and process only new data instead of reloading the entire full dataset to reduce computation power and time.
Full load was implemented for the following tables as records are added or updated slowly over time and they are relatively small:
- Circuits
- Races
- Constructors
- Drivers
On the other hand, Incremental Load was implemented for the following tables as thousands of new records are added on a weekly basis:
- Results
- Pitstops
- Lap Times
- Qualifying
Moreover, additional logic had to be implemented to incrementally load data for the following curated tables in the Gold Layer:
- Race Results
- Driver Standings
- Constructor Standings
- Calculated Race Results
The Merge function supported by Delta tables was used to perform the incremental load:
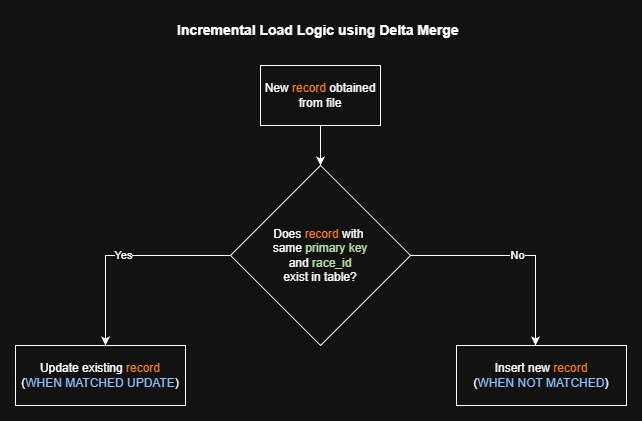
race_id. The MERGE condition matches on both race_id and primary
key, ensuring fast idempotent incremental updates using Delta Lake's transaction Merge capability.
Unity Catalog
Unity Catalog, the built-in data governance solution provided by Databricks, was used to manage and secure data assets for this project. It has great capabilities for data discovery, lineage, access control and auditing without requiring third-party products.
Features such as as Global Search and Catalog Explorer simplify discovery of tables, columns, notebooks, and dashboards. Unity Catalog also offers fine-grained Data Access Control and Data Auditing. Access Control allows fine-grained privileges to every object in Databricks, while auditing ensures that data usage complies with data governance and security.
Unity Catalog is a relatively new feature, it already covers many foundational governance capabilities. However, it still falls short of enterprise Data Catalog tools like Collibra that provide robust data governance capabilities.
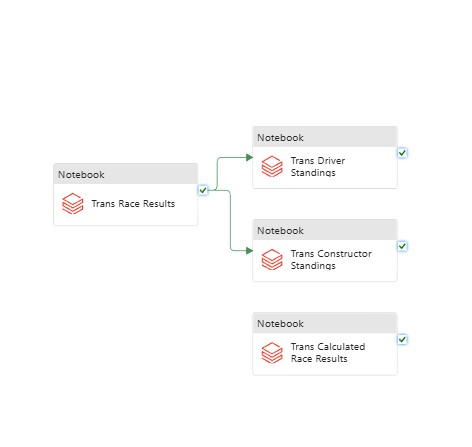
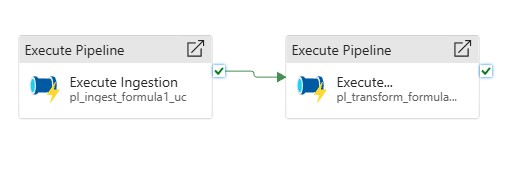
ADF Data Orchestration
Azure Data Factory was used to orchestrate the data pipelines for this project. Databricks provides built-in orchestration features such as Delta Live Tables, Workflows, and Jobs. However, ADF offers more flexible orchestration capabilities allowing multiple notebooks to run in parallel. ADF allows seamless integration with multiple systems including Databricks, which is why it was selected for this project.
A tumbling window of one week starting from the cut-over file data was selected to run the pipeline at the end Saturday. If new data files for the week are present, ADF runs the pipeline to update the dataset.
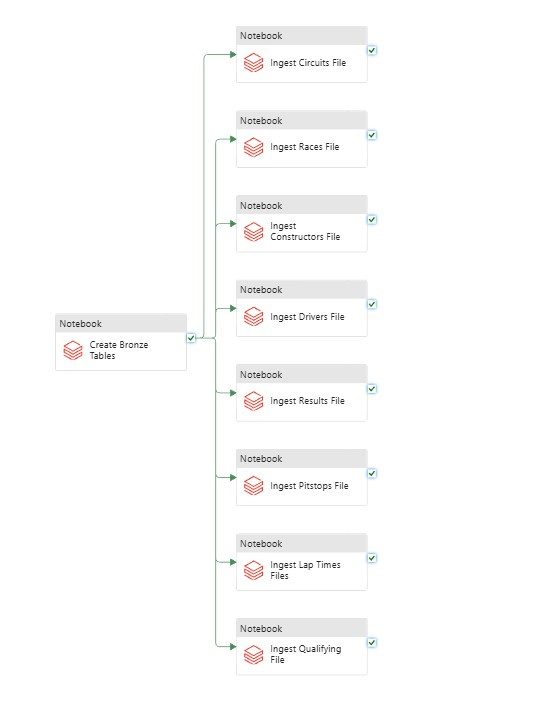
Using ADF as the orcestration layer ensured a fully automated, maintainable, and scalable data pipeline that integrated cleanly with Databricks, Unity Catalog and Azure Storage.
Analytical Insights
The core ROI of any data initiave revolves around enabling better data-driven insights and decisions. Many analytical insights can be extracted from the processed data for this project, but I focused on two different analyses which captures the long-term performance trends in Formula1.
By calculating the average points of drivers and constructors across different seasons, I identified the drivers and constructors that have performed exceptionally well over history. Average points offer a normalized view of competitive strength which allows different eras, regulations, and team structures to be compared more fairly, rather than the cumulative seasons totals.
It is interesting to observe that the most competitive seasons are often characterized by sharp rises in a driver’s or constructor’s average points. On the other hand, flatter overlapping trends showcase more dominant eras.
We can look at the above graph to identify dominant drivers across various eras in Formula1 racing including Schumacher’s peak in the early 2000s, Vettel’s surge between 2010 and 2013, and Hamilton’s continued dominance starting from when he joined Mercedes in 2013. Unfortunately, since Ergast API has been deprecated, the graph does not include data on newer drivers such as Max Verstappen.
These patterns emerge naturally through the data cleaning and modeling process, and they validate the integrity of the pipeline used to compute yearly performance.
Constructor performance trends over the years reveal long-running engineering excellence over the decades: Ferrari’s long presence across decades, Red Bull’s ascent in the 2010s, and Mercedes’ overwhelming dominance during the turbo-hybrid era. The driver and contructor historical dominance trends showcase the importance of both driver skills and engineering infrastructure in their role to shape championship outcomes.
Formula1 fans, or rather fans of any sport, love sports analytics like these as they provide historical context to their favorite athletes and teams and show the competitive landscape over the years.
Overall, these analytics demonstrate a few of the many meaningful insights that can be obtained from well-modeled data.
Resources
This project closely follows this course on Udemy by Ramesh Retnasamy. I used this course as a guideline, and I expanded the scope by building the project using Unity Catalog. I would recommend this course to anyone who is trying to get into Databricks.